Fix PostHog LLM analytics so trace, span and generation metrics match PostHog's schema - #3448
Fix PostHog LLM analytics so trace, span and generation metrics match PostHog's schema#3448manucorporat wants to merge 6 commits into
Conversation


![builder-io-integration[bot]](https://avatars.githubusercontent.com/in/353721?s=60&v=4)
This comment was marked as outdated.
This comment was marked as outdated.
Sorry, something went wrong.

|
Here's a visual recap of what changed: Open the full interactive recap |
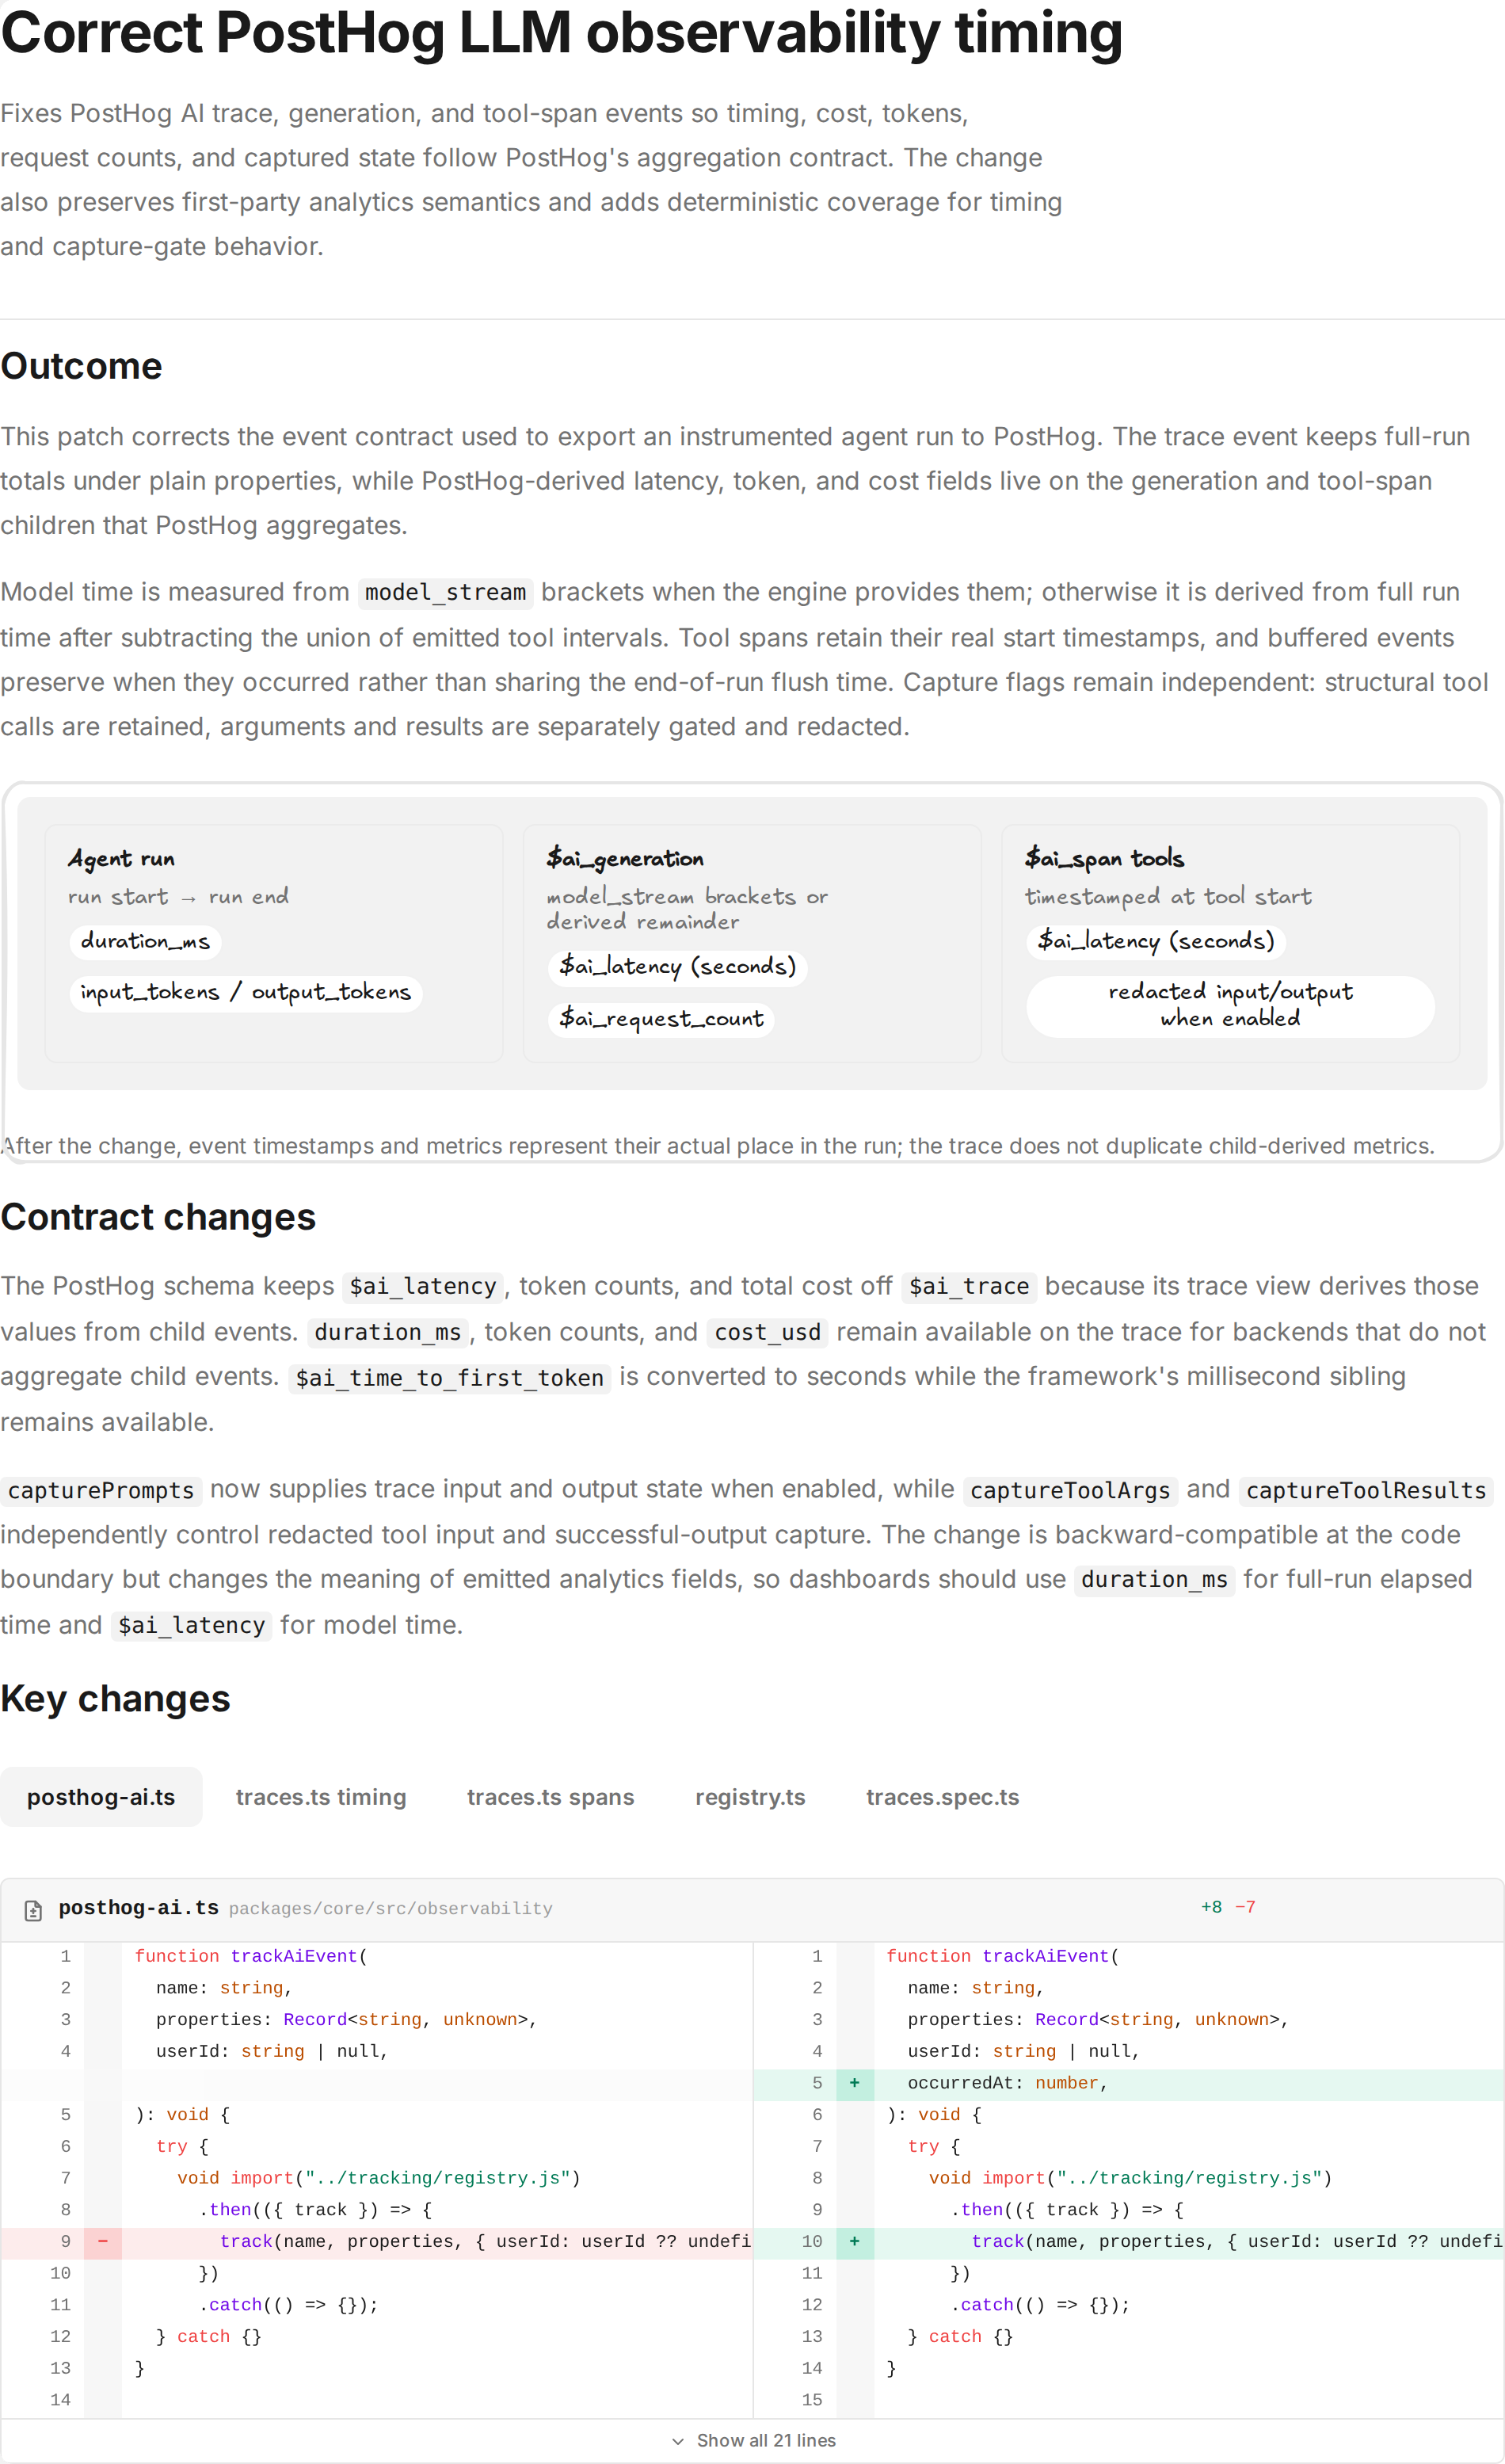
Three defects in how the PostHog trace tree is assembled, all of which made
a rendered number wrong rather than absent.

Generation latency subtracted the sum of tool span durations from the run.
Concurrent tools overlap, so the sum exceeds the time the run actually spent
in tools — a parallel fan-out clamped the generation to zero while PostHog
still summed every sibling span, putting the derived trace total over the
wall clock. The subtraction now uses the union of the tool intervals.

The subtraction also ran over every collected tool span, before the export
path applied `captureLlmSpans` and `MAX_AI_SPANS_PER_RUN`. A tool that never
reaches PostHog has no sibling span to hold its time, so subtracting it lost
that time from the visible trace entirely. The emitted set is now resolved
once, ahead of the generation event, and both use it.

Tool spans were stamped `createdAt: Date.now()` at completion while their
duration was measured from the pending start. PostHog draws a span forward
from its event timestamp, so each tool rendered as beginning where it ended
and running past the end of the trace containing it. Both the completed and
the interrupted path now stamp the start.
This comment was marked as outdated.
This comment was marked as outdated.
Sorry, something went wrong.
The generation's `$ai_latency` was the run duration with tool time backed
out of it. That subtraction is why the last three defects existed: it had to
net out overlapping tools, skip tools the export path drops, and clamp at
zero when the estimate went negative. Each of those is a special case on an
inference, and the inference was never necessary.

`production-agent.ts` already brackets every LLM round-trip with a
`model_stream` start/end pair, and that bracket closes before any tool of the
turn is started, so the two windows cannot overlap. `instrumentedSend`
already received those events and dropped them. Recording them makes model
time a measurement.

The subtraction stays as a fallback for engines that never bracket their
model calls, and `latency_source` marks which of the two a latency came
from, so an estimate is never read as a measurement.

Also drops the assumption that a trace's children must sum to its wall clock.
Two tools sharing one 40ms window really are 80ms of work, and reporting each
one honestly is worth more than a sum that flatters the total; elapsed time is
what the trace's own `duration_ms` is for.

There was a problem hiding this comment.
Builder reviewed your changes and found 2 potential issues 🟡
Review Details
Incremental Code Review Summary
The latest commit adds measured model_stream intervals and uses them for generation latency, while retaining a fallback for engines without explicit model brackets. It also preserves the earlier fixes for tool start timestamps, exported-span filtering, and overlap handling. I verified the two prior review concerns in the updated code and resolved their stale threads before this review. This remains standard risk because the changes affect shared observability and tracking behavior.
New Findings
- 🟡 MEDIUM — The implementation aggregates multiple disjoint model-stream intervals into one
$ai_generationevent emitted at run start. In multi-step runs with tools between model calls, PostHog renders the entire measured model duration at the beginning and cannot represent the later model round-trip at its actual position. - 🟡 MEDIUM —
occurredAtis converted into the framework event timestamp, but the PostHog event serializer places that timestamp only insideproperties; PostHog’s capture payload expects event time at the payload level. As a result, the new timeline correction may not affect PostHog ingestion ordering.
The new model-time instrumentation is directionally useful, and the added tests improve coverage, but generation events need a timeline representation that matches their aggregated duration and the provider must serialize occurrence time in the field PostHog actually consumes.
🧪 Browser testing: Skipped — PR only modifies backend/config/docs/tests, no UI impact
| llmDurationMs, | ||
| llmDurationMeasured: measuredModelDurationMs !== undefined, |
There was a problem hiding this comment.
🟡 Do not represent disjoint model intervals as one generation span
llmDurationMs now aggregates multiple model_stream intervals, but the single $ai_generation is still timestamped at runStart. In a multi-step run with tool time between model calls, PostHog renders the aggregate model duration at the beginning of the trace, so the later model round-trip is absent from its actual position. Emit generations per model interval or otherwise use a contiguous interval whose timestamp and duration match the displayed timeline.
Additional Info
Reported independently by 2 of 3 incremental code-review agents; distinct from the previously reviewed parallel-child aggregation issue.

| timestamp: new Date().toISOString(), | ||
| // A caller-supplied `occurredAt` of 0 is not a real event time, so `||` | ||
| // rather than `??` is deliberate here. | ||
| timestamp: new Date(occurredAt || Date.now()).toISOString(), |
There was a problem hiding this comment.
🟡 Serialize occurred-at as PostHog event time
occurredAt is converted into TrackingEvent.timestamp, but the PostHog provider currently serializes that value inside properties rather than the capture payload’s top-level event timestamp field. Consequently, buffered AI events may still be ordered by ingestion/flush time despite this new API. Pass the timestamp in the PostHog field used for event time and add a provider-level serialization test.
Additional Info
New provider-integration issue identified by one incremental review agent and verified against the current serializer; anchored on the changed `occurredAt` line because the provider file is not in this PR diff.

The trace timing tests slept for real and asserted on the elapsed result, so
they were measuring the scheduler as much as the code. On a loaded CI runner a
20ms sleep stretched past 200ms and two of them failed: a measured latency
came back 0.234s against a `< 0.06` bound, and the overlap test's premise
(summed tool spans exceed the run) stopped holding once the run outgrew the
tool window.

Replaces every sleep in those tests with a hand-advanced `Date.now`. Nothing
waits, so the arithmetic under test is the only variable left, and the
assertions tighten from ranges to exact values — 40ms of model time in an 80ms
run, three 40ms tools covering one 40ms window, a span starting exactly where
its trace does. The clock is restored in `afterEach` so a failing assertion
cannot leak it into the rest of the file.

All five still fail against the pre-fix code, now with exact diffs.
This comment was marked as outdated.
This comment was marked as outdated.
Sorry, something went wrong.
`captureLlmSpans` decides whether each tool call gets its own `$ai_span`
event. Whether a call may carry its arguments is `captureToolArgs`. Review
read the first as if it were the second and asked for the generation's tool
list to be emptied along with the span events, which would leave a trace
showing a model that answered with no sign it called anything.

Nothing here changes behavior — both tests pass unmodified against the code
from before this branch's latency work. They exist because the contract was
only legible by reading two config flags and a nested metadata guard, and
that is not a durable way to keep the next reader from "fixing" it.
There was a problem hiding this comment.
Builder reviewed your changes — no new findings
Review Details
Incremental Code Review Summary
The latest commit adds deterministic clock-based tests and clarifies the intended handling of concurrent tool spans: measured model time remains distinct from elapsed trace duration, and concurrent child work is intentionally represented as additive work in PostHog. The previously reported disabled-span-capture privacy issue is fixed: the new coverage confirms tool-call structure remains visible while arguments remain governed by captureToolArgs; I resolved that stale thread. The two remaining open findings—disjoint model intervals represented by one generation event and occurredAt serialization for PostHog—remain unchanged and were not reposted. This remains standard risk due to shared observability and tracking changes.
No new confirmed bugs were found by the three parallel reviews. Focused validation reported 48/48 observability tests passing. Browser verification is not applicable because this PR has no user-facing UI impact.
🧪 Browser testing: Skipped — PR only modifies backend/config/docs/tests, no UI impact
2 participants


Every one of these made an LLM analytics number wrong rather than missing, which is the harder kind to notice — the dashboards rendered, they just did not mean what they said.
Metrics that were wrong
$ai_time_to_first_tokenis now sent in seconds. It was handed the millisecond value verbatim, inflating every time-to-first-token in LLM analytics 1000×.$ai_traceno longer carries$ai_latency,$ai_input_tokens,$ai_output_tokensor$ai_total_cost_usd. PostHog derives all four from a trace's children and summed the trace's own$ai_latencyalongside them, reporting roughly twice the real run duration. The run totals now ride along asduration_ms,input_tokens,output_tokensandcost_usdfor backends that do no such aggregation.$ai_latencyis model time (run duration minus tool time) instead of the whole run, so tool duration is no longer counted both in the generation and in its sibling tool spans.$ai_request_countreports the run's real LLM round-trip count instead of a hardcoded1, which undercharged multi-step runs on request-priced models.Views that were empty or misleading
$ai_tracenow carries$ai_input_state/$ai_output_statewhencapturePromptsis on. PostHog reads a trace's input and output only from that event, so the trace detail view was blank.captureToolResults, so a healthy tool span reports an output instead of looking like a tool that returned nothing.track()takes anoccurredAt; without it a whole trace tree collapsed into a single instant, because PostHog orders the tree by event timestamp. A caller-supplied0is deliberately not treated as a real event time.$ai_streamis set, which is what makes$ai_time_to_first_tokenmeaningful in the first place.Namespace
$ai_prefix ($ai_input_truncated→input_truncated,$ai_spans_dropped→spans_dropped). That namespace is PostHog's schema, and a name it does not define today it may define tomorrow.Deliberately not changed
$ai_inputstays the conversation and excludes the system prompt. PostHog accepts asystemrole, but the prompt is app configuration rather than content and is near-identical on every run — shipping it would repeat kilobytes per generation for no analytical gain.Tests
Adds
traces.spec.ts(212 lines) covering the trace/generation/span split, the unit conversions, the timestamp handling and the property namespace.src/observability/andsrc/tracking/: 205 passing.