


Sparklines brings Edward Tufte's sparklines to your terminal — compact Unicode bar charts like ▃▁▄▁▅█▂▅, right in your shell or Python code. Originally built for sanity-checking sensor data in IoT networks, it works anywhere you need a quick visual summary of a sequence of numbers.
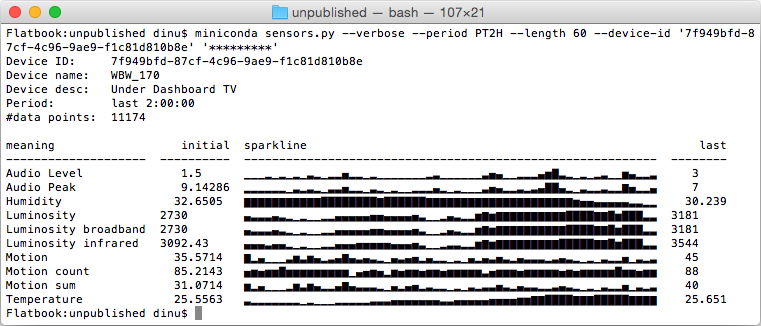
Example usecase for such "sparklines" on the command-line,
showing IoT sensor values (generating code not included here).
Positive values work best, but negatives are fully supported: mixed data auto-splits into two rows, all-negative data renders as downward bars (see Mixed and negative datasets below). True line-style sparklines would require a dedicated font — out of scope here. We use "▁▂▃▄▅▆▇█" for values and a blank for missing ones.
Finance — stock price history, daily P&L (bipolar: gains above, losses below), trading volume spikes, bid-ask spread over a session.
IoT — temperature and humidity sensors, power consumption per circuit, air quality index, battery charge on remote devices.
DevOps & SRE — request rate and error rate per minute, CI build duration trend, queue depth, replica lag.
Data Science & ML — training loss and validation accuracy per epoch, gradient norms, data drift score, inference latency after a deployment.
Agentic computing — token usage and cost per API call, context window fill level, cache hit rate, tool-call frequency per agent loop iteration.
Health & Fitness — heart rate during exercise, sleep quality over weeks, blood glucose across a day, daily caloric balance.
A recorded demo session — click the image to play it on Asciinema:

From PyPI
pip install sparklinesOn macOS with Homebrew
brew tap deeplook/sparklines
brew install sparklines
With uv
uvx sparklines 2 7 1 8 2 8 1 8Or install it into your uv tool environment:
uv tool install sparklinesFrom Source
git clone https://github.com/deeplook/sparklines.git
cd sparklines
pip install .
Development
git clone https://github.com/deeplook/sparklines.git
cd sparklines
pip install -e ".[dev]"
pytest testsfrom sparklines import sparklines
for line in sparklines([1, 2, 3, 4, 5.0, None, 3, 2, 1]):
print(line)
# ▁▃▅▆█ ▅▃▁
for line in sparklines([1, 2, 3, 4, 5.0, None, 3, 2, 1], num_lines=2):
print(line)
# ▁▅█ ▁
# ▁▅███ █▅▁Mixed positive/negative data is split automatically — no flags needed:
from sparklines import sparklines

data = [50, 30, 80, -20, -60, -10, 40, 10]
for line in sparklines(data):
    print(line)
# ▅▄█   ▄▂
#    ▔▀▔
All-negative data renders as inverted (downward) bars automatically.
-n / --num-lines
| Form | Behaviour |
|---|---|
integer (default 1) |
total rows, split proportionally; shared scale |
auto |
smallest row count for an exact proportional split |
up:down (e.g. 2:1) |
explicit per-side layout; independent scaling |
$ sparklines -n auto 1 2 3 -1 -2 -3 0 4 5 6
       ▃▆█
▄▆█   ▁███
   ▔▔▀
$ sparklines -n 2:1  1 2 3 -1 -2 -3 0 4 5 6
       ▃▆█
▄▆█   ▁███
▔▀█--zero: up (default) places zeros on the positive baseline; none renders them as gaps.
$ sparklines --zero up   0 1 2 -1 -2 0
▁▄█  ▁
   ▀█
$ sparklines --zero none 0 1 2 -1 -2 0
 ▄█
   ▀█
Downward bars use ANSI reverse video for full 8-level resolution. Falls back to ▔▀█ when NO_COLOR, ANSI_COLORS_DISABLED, or TERM=dumb is set.
Inspired by Zach Holman's spark, with prior Python ports by Kenneth Reitz (spark.py), RedKrieg (pysparklines), and Roger Allen (shorter spark.py).
This package adds:
- multi-line rendering for higher resolution (-n)
- gaps for missing values (None)
- auto-split for mixed positive/negative data
- inverted bars for all-negative data
- proportional row allocation (-n auto)
- explicit per-side layout (-n up:down)
- zero handling (--zero up / --zero none)
- colour emphasis via --emphasize
- line wrapping via --wrap