


The EUV Snapshot Imaging Spectrograph (ESIS) is a NASA sounding rocket mission designed to measure the speed of plasma in the solar atmosphere. ESIS was launched from White Sands Missile Range on September 30th, 2019, and is planning to launch again in 2027.
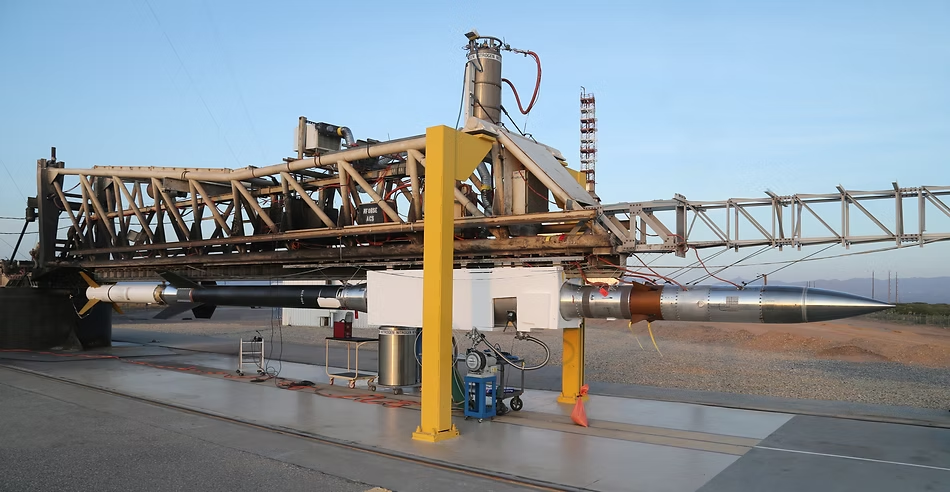
ESIS is a computed tomography imaging spectrometer (CTIS): four cameras look at the Sun through gratings mounted at different azimuths, so every camera records a dispersed image of the whole field of view in a single exposure. Inverting the four overlapping projections recovers a spatial-spectral cube, which measures the Doppler shift of the spectral lines in the ESIS passband without ever scanning a slit across the target.
This repository provides a Python package that models the ESIS optical system and analyzes the images captured during flight in terms of physically-meaningful quantities.
ESIS is published on PyPI and can be installed using pip:
pip install euv-snapshot-imaging-spectrographTo work on the package itself, install it from source:
git clone https://github.com/esis-mission/esis
cd esis
pip install -e .[test]
The Level-0 flight images are too large to ship with the package, so they are
downloaded the first time they are needed and unpacked into ~/.esis/data
(override with the ESIS_DATA_DIR environment variable).
Derived products are memoized under ~/.esis/cache.
- A parametric model of the ESIS optical system (front aperture, central obscuration, primary mirror, field stop, gratings, thin-film filters, and cameras) built on optika.
- Raytrace-based characterization of the instrument: point spread function, effective area, throughput, vignetting, and distortion.
- Both the final optical design and an as-built model of the instrument that actually flew, along with the best-fit distortion parameters recovered from the flight images.
- A data-reduction pipeline organized by processing level, from the raw FITS files (Level 0) to calibrated maps of the photons incident on each sensor (Level 1), with bias and dark subtraction and cosmic-ray removal.
- Synthetic solar scenes assembled from SDO/AIA and IRIS observations, for validating the forward model against a known truth.
- Flight-specific configurations for both the 2019 flight (
f1) and the planned 2027 flight (f2), including the NSROC timelines. - Every model and dataset is an n-dimensional named-arrays object, so wavelength, field, pupil, channel, and time are addressed by name, and uncertainties propagate automatically.
| Quantity | Requirement |
|---|---|
| Spatial resolution | 1.5 Mm |
| Spectral resolution | 18 km/s |
| Field of view | 10 arcmin |
| Signal-to-noise ratio | 17.3 |
| Cadence | 15 s |
| Observation length | 150 s |
These are available programmatically from
esis.flights.f1.optics.requirements().
Load the final optical design of the first flight:
import esis

instrument = esis.flights.f1.optics.design()
Load the calibrated images gathered during the 2019 flight and plot one frame. The flight data is downloaded on the first call and the Level-1 product is cached, so subsequent calls load the stored result:
import matplotlib.pyplot as plt
import named_arrays as na
import esis

a = esis.flights.f1.data.level_1()
a = a[{a.axis_channel: 2, a.axis_time: 15}]

fig, ax = plt.subplots(constrained_layout=True)
na.plt.pcolormesh(
    a.inputs.pixel,
    C=a.outputs.value,
    ax=ax,
    vmin=0,
    vmax=a.outputs.percentile(99.9).ndarray.value,
)
plt.show()The full documentation, including the API reference and a gallery of reports that reproduce the instrument characterization and the data reduction, is hosted at esis-mission.github.io.
If you use this package in your research, please cite the ESIS mission paper:
Parker, J. D., Smart, R. T., Kankelborg, C., Winebarger, A., and Goldsworth, N. 2022, "First Flight of the EUV Snapshot Imaging Spectrograph (ESIS)", The Astrophysical Journal, 938, 116. doi:10.3847/1538-4357/ac8eaa
The Level-0 flight data is archived separately: doi:10.5281/zenodo.21997280